
PHP性能问题诊断与排查
2012-06-06 15:10:49 来源:我爱运维网 评论:0 点击:
最近PHP性能问题频发,share一下最近对php Perfromance tracing思路和方法便于大家诊断和故障排查:宏观层面的监测工具大家都比较熟悉主要...

宏观层面的监测工具大家都比较熟悉主要关注CPU和network IO,这次主要介绍一下微观层面Php profiling(Xhporf)工具的使用和数据诊断:
* 宏观层面
- CPU
- Top
- load average
- Vmstat
- R
- cs
- Memory
- IO
- Iostat
- Network
- Mpstat
* 微观层面
- Strace
- Strace system call
- Strace PHP master process statistics
- Php-fpm configuration
- pm = static
- pm.max_children = 500
- request_slowlog_timeout = 6
- request_terminate_timeout = 10
- pm.max_requests = 1500
由于PHP服务器负载可以量化,不建议使用dynamic模式,static模式可以减少频发进程创建和消耗开销。
- Slow request
- Slow URL
抓起响应慢的url进行profiling分析
- Profiling
- Xhporf
诊断思路:从宏观层面分析系统资源消耗,如CPU bound or IO bound 等,目前PHP均是CPU bound和network IO消耗。跟踪Slow log,发现影响时间消耗最长的URL,添加Xhpof去定位详细的资源消耗。
* Xhporf installation and configuration
* Installation
* $wgethttp://pecl.php.net/get/xhprof-0.9.2.tgz
$tar xvf xhprof-0.9.2.tgz
$cd./xhprof-0.9.2/extension/
$/usr/local/php5/bin/phpize
$./configure --with-php-config=/usr/local/php5/bin/php-config
$make
$make install
xhprof.so将被生成在/usr/local/php5/lib/php/extensions/no-debug-non-zts-20090626/
cp xhprof.so to /usr/local/php5/lib/php/extensions
mkdir –p /home/logs/php/xhprof_log* Configuring
- 编辑/usr/local/php5/lib/php.ini
添加下面内容到php.ini
[xhprof]
extension=xhprof.so
xhprof.output_dir="/home/logs/php/xhprof_log"* copy xhprof_html and xhprof_lib to web_root folder
- 修改响应时间慢的页面来自于Slow request log
如:application/index.php
在index.php头部加入下面
if (mt_rand(1, 100) == 1) {
if (extension_loaded('xhprof')) {
include_once '/home/pplive/web/test/xhprof_lib/utils/xhprof_lib.php';
include_once '/home/pplive/web/test/xhprof_lib/utils/xhprof_runs.php';
xhprof_enable(XHPROF_FLAGS_CPU + XHPROF_FLAGS_MEMORY);
$xhprof_on = true;
}
}
在index.php尾部加入下面
if ($xhprof_on) {
if (extension_loaded('xhprof')) {
$profiler_namespace = 'prd'; // namespace for your application
$xhprof_data = xhprof_disable();
$xhprof_runs = new XHProfRuns_Default();
$run_id = $xhprof_runs->save_run($xhprof_data, $profiler_namespace);
}
}* 数据分析和诊断
Xhprof生成log在/home/logs/php/xhprof_log/4fcee1683ed38.prdURL:http://address/index.php?run=4fcee1683ed38&source=prd
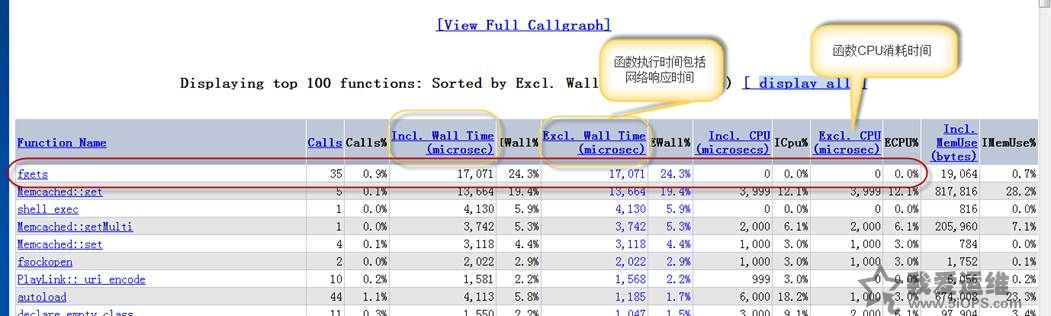
- Overall SummaryPage显示页面调用统计和详细的方法call,使用EXcl WALL time 排序可以得到消耗时间最长的方法调用便于发现系统或者子系统调用统计
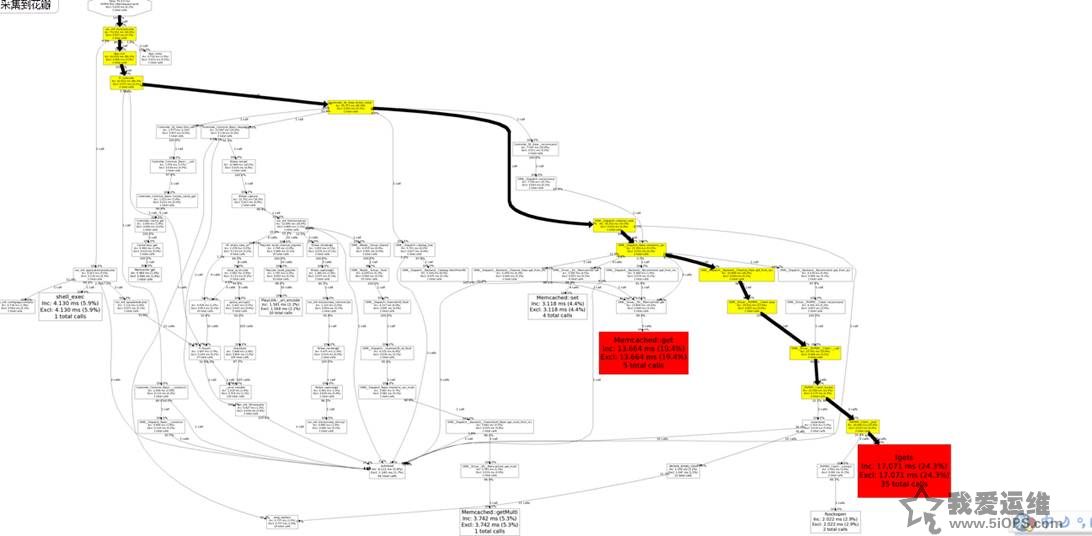
- View Full Callgraph 显示方法调用关系,红色部分显示存在严重瓶颈的方法,如下图显示_PHPRPC_Client::_post和ORM__Driver__KV__Memcached::get存在严重性能瓶颈,便于快速发现子系统状况。
结论:
通过xhpof能够帮助运维理解业务关系,快速诊断系统和子系统调用关系,通过数据挖掘可以快速定位系统或者子系统的健康状况。
分享到:
 收藏
收藏
收藏
评论排行
- ·Windows(Win7)下用Xming...(92)
- ·使用jmx client监控activemq(20)
- ·Hive查询OOM分析(14)
- ·复杂网络架构导致的诡异...(8)
- ·使用 OpenStack 实现云...(7)
- ·影响Java EE性能的十大问题(6)
- ·云计算平台管理的三大利...(6)
- ·Mysql数据库复制延时分析(5)
- ·OpenStack Nova开发与测...(4)
- ·LTPP一键安装包1.2 发布(4)
- ·Linux下系统或服务排障的...(4)
- ·PHP发布5.4.4 和 5.3.1...(4)
- ·RSYSLOG搭建集中日志管理服务(4)
- ·转换程序源码的编码格式[...(3)
- ·Linux 的木马程式 Wirenet 出现(3)
- ·Nginx 发布1.2.1稳定版...(3)
- ·zend framework文件读取漏洞分析(3)
- ·Percona Playback 0.3 development release(3)
- ·运维业务与CMDB集成关系一例(3)
- ·应该知道的Linux技巧(3)
频道总排行

